Overview
A spectrum analyzer is a powerful instrument that lets you capture the wireless signals around you. In this lab you will use a spectrum analyzer to look at real-time wireless signals and examine previously captured signals.
Objectives
- Get familiar with how a spectrum analyzer works and how to use one
- Identify characteristics of WiFi and other signals
Questions
Answer the questions on a separate paper or document and submit it through LS.
Live Capture
To start out, if SignalVu is not already open, open it from the icon on the desktop. Close all previously open windows. Next, in the menu click Presets > DPX menu item (it might already be on this window). This will bring up the DPX window, which defaults to the last used center frequency. The spectrum analyzer is capable of looking at 40 MHz of spectrum at one time, which is wide enough to view most of the 2.4 GHz spectrum.
- What center frequency does the spectrum analyzer need to be adjusted to in order to be in the middle of the 2.4 GHz spectrum? Use the following figure to help you figure it out. In the United States, you can only transmit on channels 1 through 11 so you only need to account for those channels.

Adjust the spectrum analyzer to that center frequency with a span of 40 MHz. This can be done by changing the “Frequency” and “Span” parameters at the bottom of the DPX window:

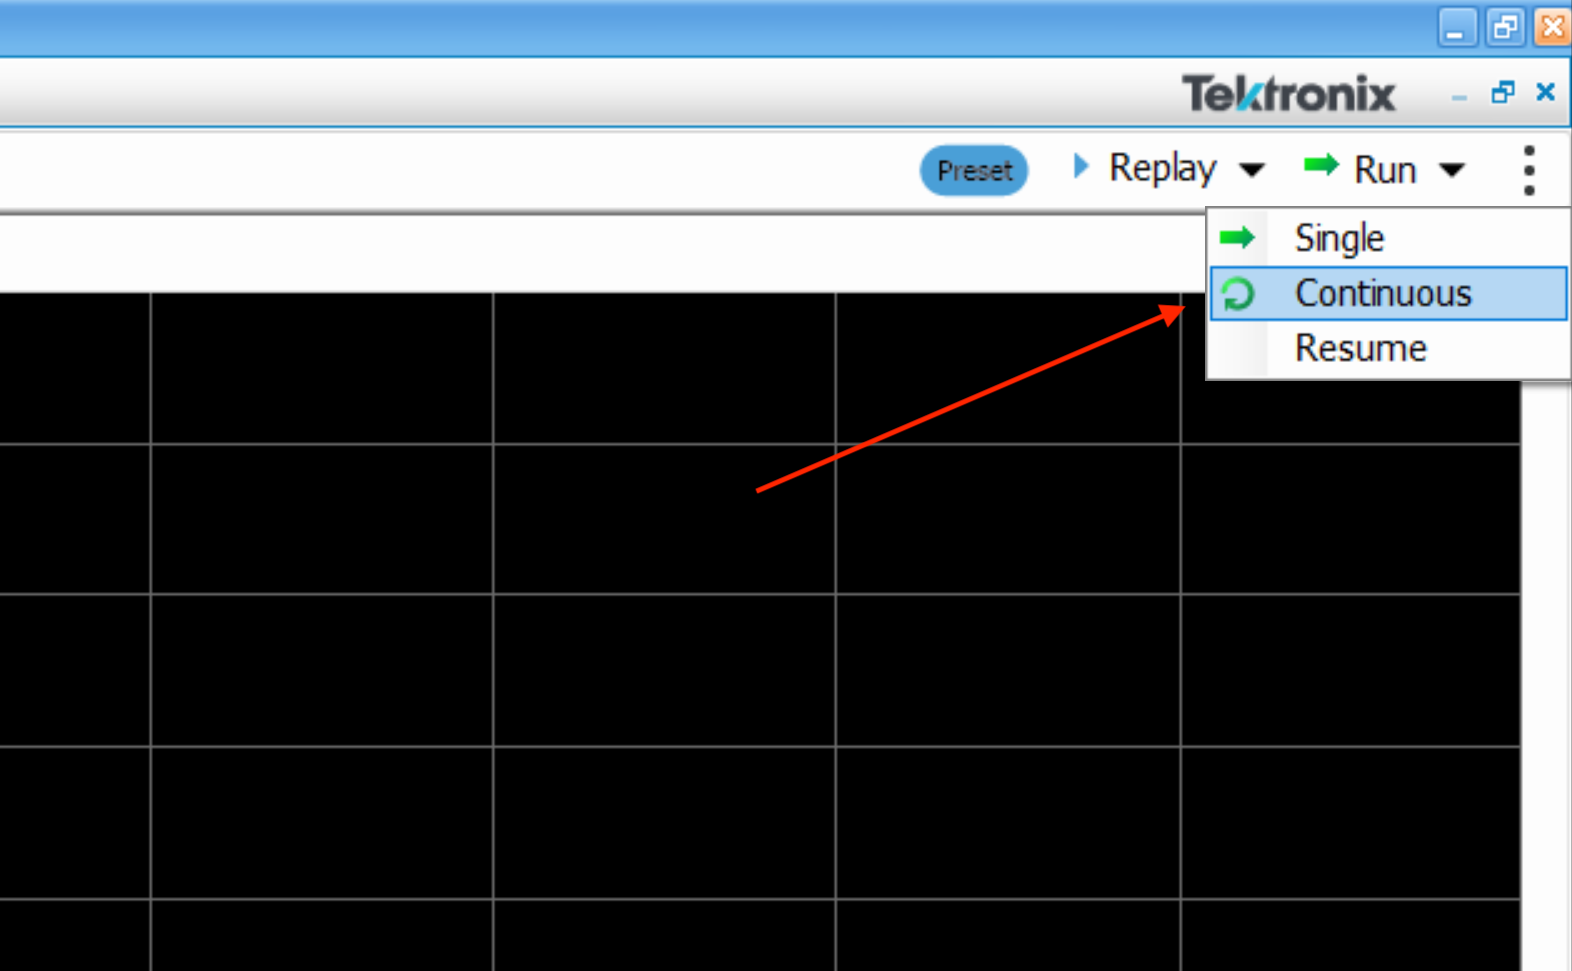
The last thing you might need to do is tell the spectrum analyzer to start collecting data. To do that, use the “Run” button in the top right corner and change the mode to “Continuous”. If it is already displaying samples and the bottom shows “Stop”, then it is already collecting data.
You should now be able to see wireless signals occurring in real time! Move the center frequency by using the up and down arrow keys when the “Frequency” text box is selected.
- Do you see any active transmissions? Explain what they might be.
Use a WiFi device, such as a smartphone or laptop, and have it scan for access points. This can usually be done by opening up the WiFi settings to view all of the available networks.
- What occurs on the spectrum analyzer when your WiFi device scans for available access points?
This is your device actively scanning for available access points. Try putting devices close to the antenna to see what happens. For example, Bluetooth headphones that are playing music or a smartphone that is downloading data.
Run the microwave next to the spectrum analyzer for a few seconds.
- What happens when the microwave is on?
Now that you have seen wireless signals in real time, we are going to look at some previously collected captures.
Open up file Desktop/lab1/1.tiq (File > Recall..) and select the “Data and setup” option. This will change the setup of your windows. The windows that you should now have up are “Time Overview”, “Spectrum”, and “Spectrogram.” Close the “DPX Spectrum” window. The “Time Overview” gives you the signal in the time domain, the “Spectrum” window gives you the signal in the frequency domain, and the “Spectrogram” window (or waterfall graph) gives you the signal in both the time domain and the frequency domain. The y-axis is time, and the x-axis is the frequency, with the color of the graph representing the signal strength. All windows have settings that can be changed along their status bar. This allows you to zoom in/out to look at a signal more closely or change the position of the graph.
Since this is previously captured data, we are able to replay it as many times as we want. First, ensure that the “Replay” toolbar is showing by selecting from the menu View > Replay Toolbar. It should look like:

Make sure you have selected “Acq Data” in the dropdown box. Replay the captures by selecting “Replay Loop” from the playback controls (right-most button that is circle arrow). This will show you what has been captured in the file, repeated. The spectrum analyzer works by sampling the spectrum for a certain amount of time and then processing that data. Though it gives the impression that it is continuously sampling the spectrum, in actuality, it is not. For example, this capture contains 118 samples with each sample only capturing 4.467 µs of the spectrum. Each sample is 30 ms apart from each other. This has two implications: the spectrum analyzer might capture only part of a wireless transmission, and it might miss wireless transmissions between captures. This means that a capture like this might not give you the whole story of what is happening in the spectrum.
Markers
Markers are an important way to measure different characteristics of a signal, such as time, frequency, and signal strength. Ensure that the Markers toolbar is showing by selecting from the menu View > Markers Toolbar. The first marker you place is the marker reference (shown as “MR”). The second marker you place (shown as “M1”) will show statistics about itself (top left corner of the window) and relative to the reference marker (top right corner of the window). The relative statistics are helpful when trying to determine the bandwidth of a signal or the duration of a signal. Additional markers can be placed as needed. Place some markers and get familiar with the controls. This can be done by clicking the down carrot on the left of the Markers Toolbar or by right clicking on a graph and selecting “Add Marker”. Markers can be moved by dragging them around.
Wireless Frames
Using the Replay toolbar, move to a frame that shows a WiFi signal. This is done by stepping through individual frames until you see a transmission. For example, capture 4 contains a WiFi frame. Find a different capture that contains a WiFi frame and answer the following questions, using that frame and makers. Since the signal is the same in all the samples, it doesn’t matter which transmission you select.
-
What is the frame number that you are using? This is shown in the Relay Toolbar next to the timestamp of the sample.
-
What is the start and end frequency of the signal in the sample? Record your answers to three decimal places.
-
What channel do these frequencies correspond to? Use the handout provided.
-
What is the bandwidth of the frame?
-
What is the highest signal strength of the signal?
-
What type of signal is this frame? OFDM or DSSS? How can you tell?
As explained above, the spectrum analyzer only samples the spectrum for a small amount of time. To avoid the problem of missing transmissions or capturing only part of a transmission, the spectrum analyzer is able to sample for extended periods (about a few seconds—it depends on the number of samples per second and the capacity of the spectrum analyzer). This allows you to see every wireless transmission that is sent over a period of time. The downside to this approach is that the file is much larger and can take longer to analyze and display.
Open up the file Desktop/assignment/2.tiq. Notice how long it takes to load the file. You can determine the progress on the status bar at the bottom of the window:

The spectrum analyzer is done processing the data when it displays “Stopped” on the status bar. This capture contains 802.11 beacon frame transmissions, along with some other transmissions. You can determine which transmissions are the 802.11 beacon frame because beacon frames are sent out at fixed intervals. To determine which transmissions are beacon frames, use the Time Overview window. To zoom into a signal, right click on the window and select “Zoom” or “Pan”. Place markers to find the time difference between transmissions and other information about the beacon. Which ever frames have a fixed interval between them are the beacon frames. Answer the following questions.
-
What is the beacon frame interval? Hint: It is not the default beacon frame rate.
-
What is the duration of the transmission of the beacon frame?
-
Based on the duration of the transmission and given that the size of these beacon frames is 99 bytes, what is the data rate of the beacon frames?
-
What type of signal is the beacon frame transmission? OFDM or DSSS? How can you tell? You will need to move a marker in the “Time Overview” or “Spectrogram” window to change the graph on the “Spectrum” window.
-
Using the Spectrogram window, what channel are the beacon frames being sent on? You will have to find the marker that you placed in the time domain.
After you are done answering the questions, close out of all of the windows, but leave SignalVu open. Turn the assignment in through Learning Suite.